> For the complete documentation index, see [llms.txt](https://docs.zero.inc/llms.txt). Markdown versions of documentation pages are available by appending `.md` to page URLs; this page is available as [Markdown](https://docs.zero.inc/features/reports.md).
# Reports
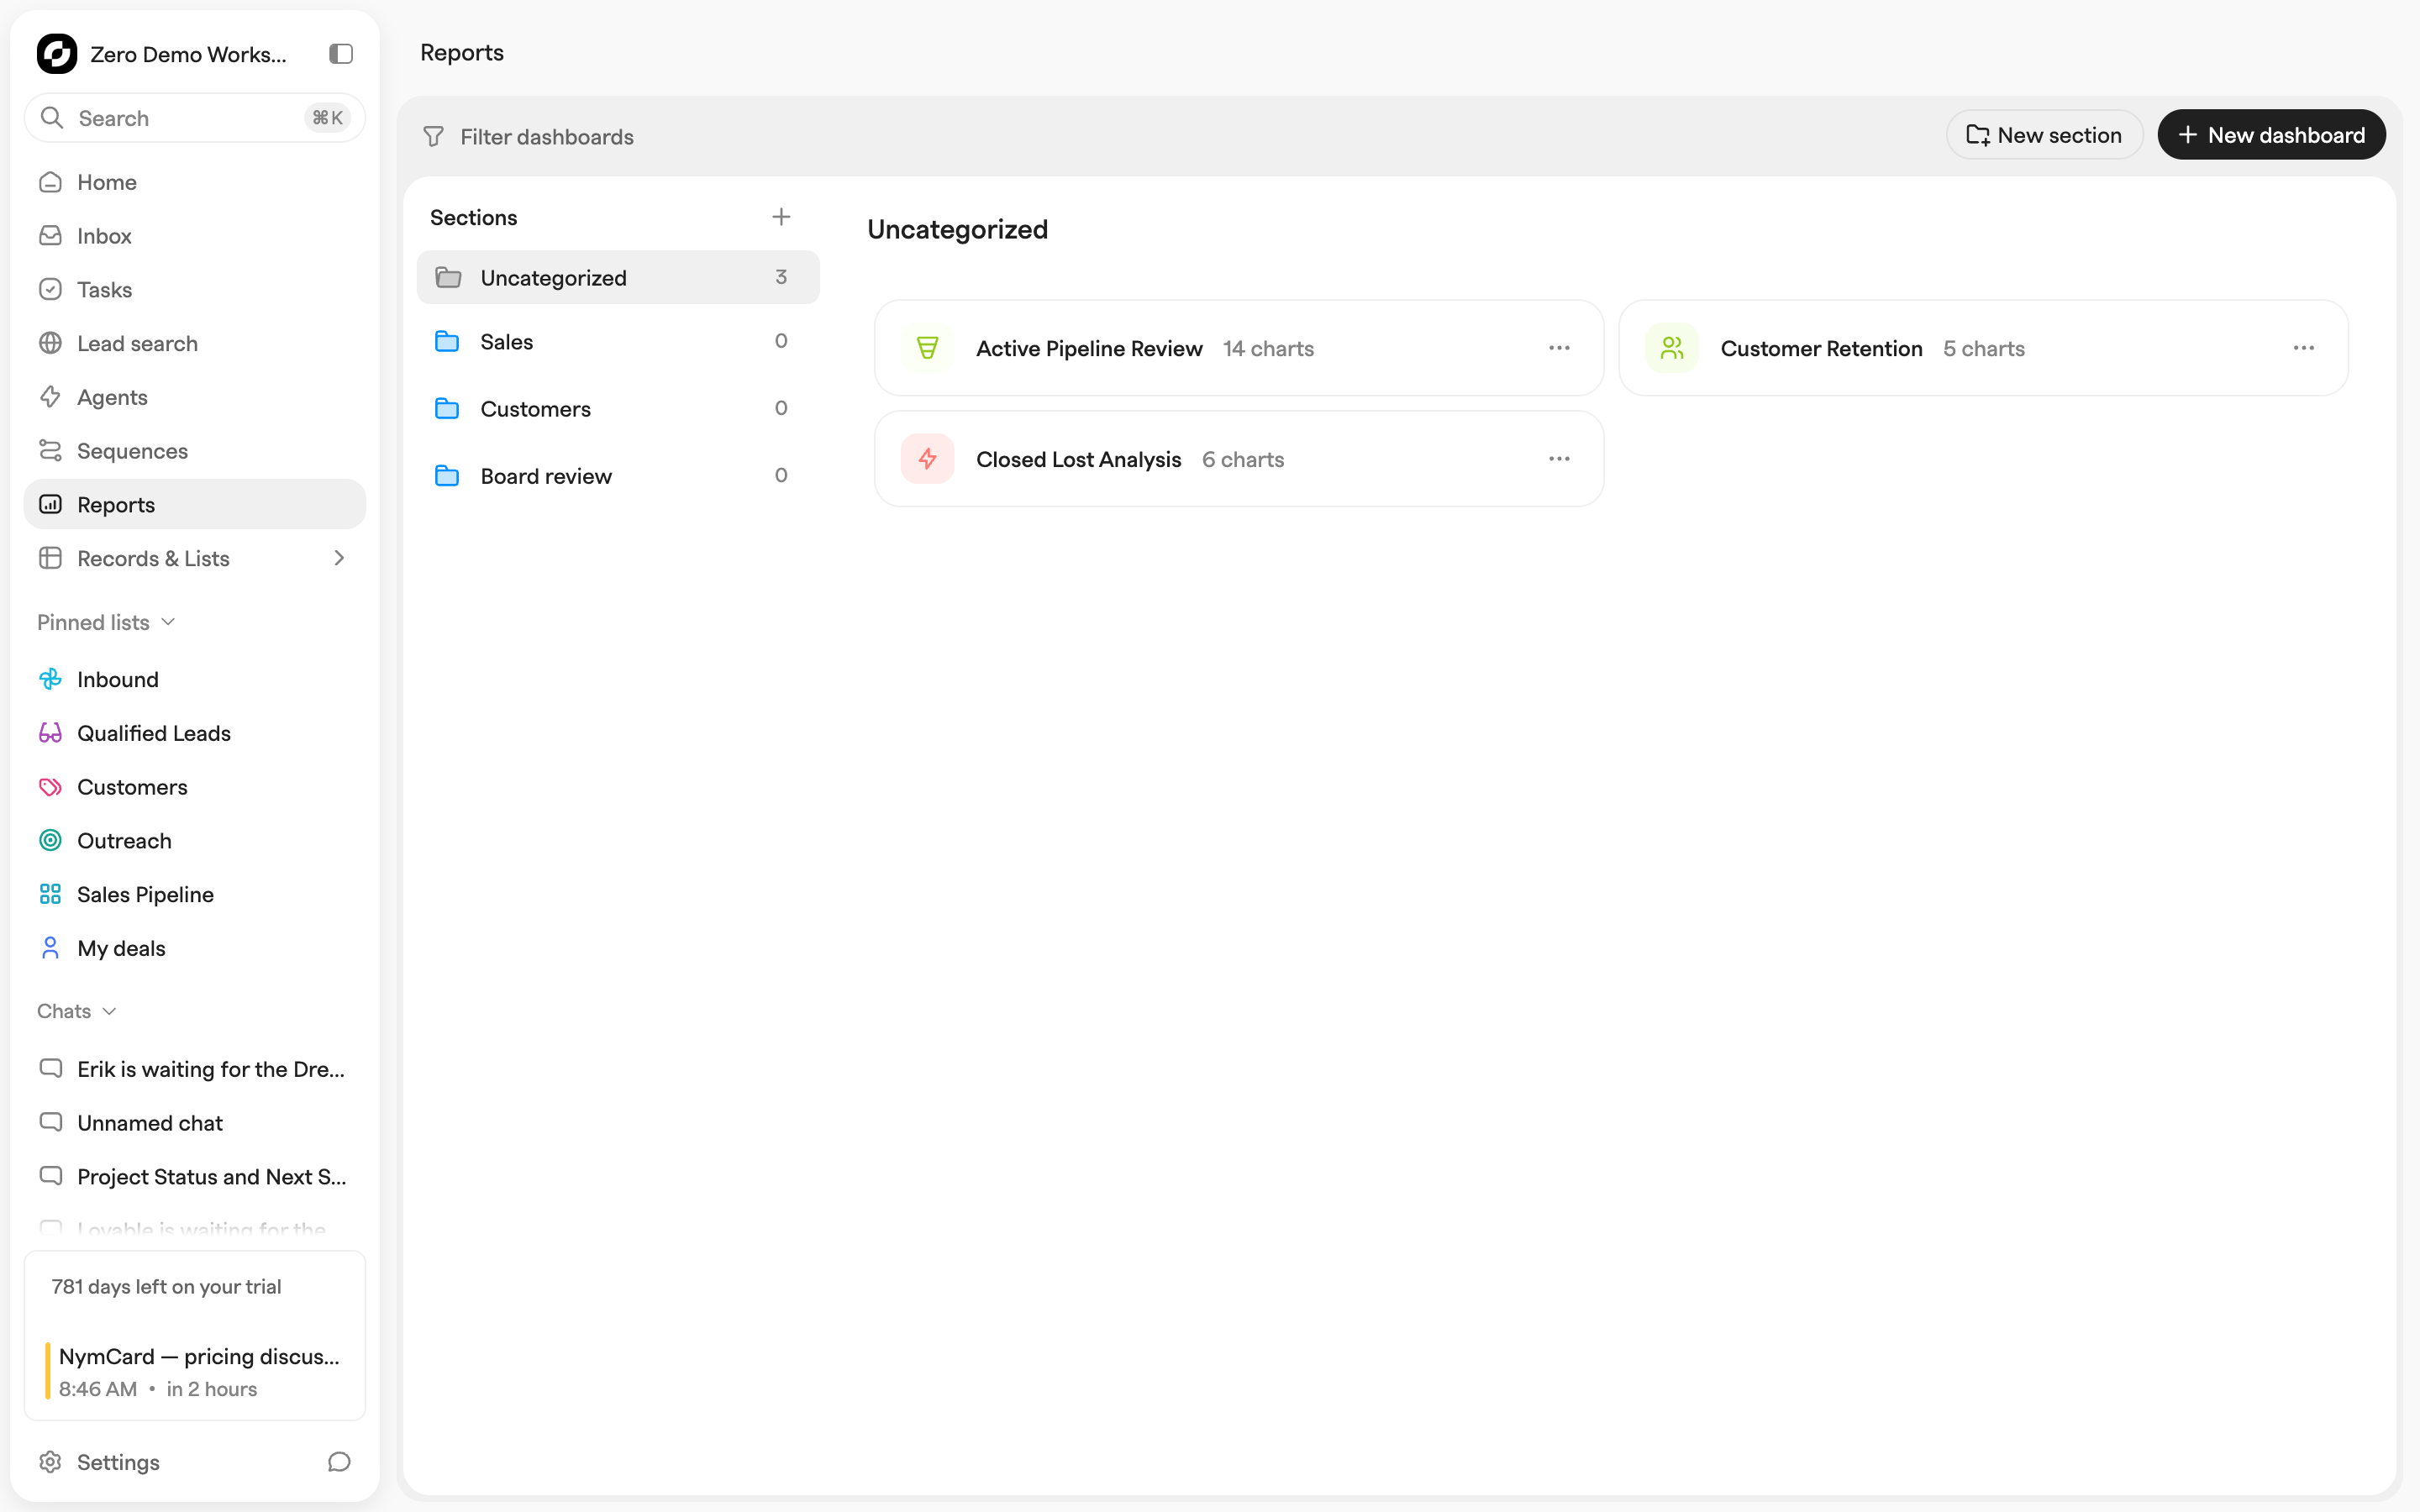
The questions you ask of a CRM tend to repeat every week — what is in the pipeline, what closed, who is carrying what. Reports answer them once and keep answering: live charts over the same records your team works every day, grouped onto dashboards, with no export needed to build the picture. Open **Reports** in the sidebar for every dashboard in the workspace.
## Dashboards
Dashboards are grouped into **Sections** on the Reports page.
* **New dashboard** opens straight into edit mode with an empty chart and its settings sidebar ready.
* **Filter dashboards** narrows by name, or by who created one and when.
* **New section** adds a group; drag dashboards between sections in the left panel. Deleting a section moves its dashboards to *Uncategorized* rather than deleting them.
* Each row's menu holds **Clone dashboard** (charts and all), **Move to section** and **Remove dashboard**.
## Building a dashboard
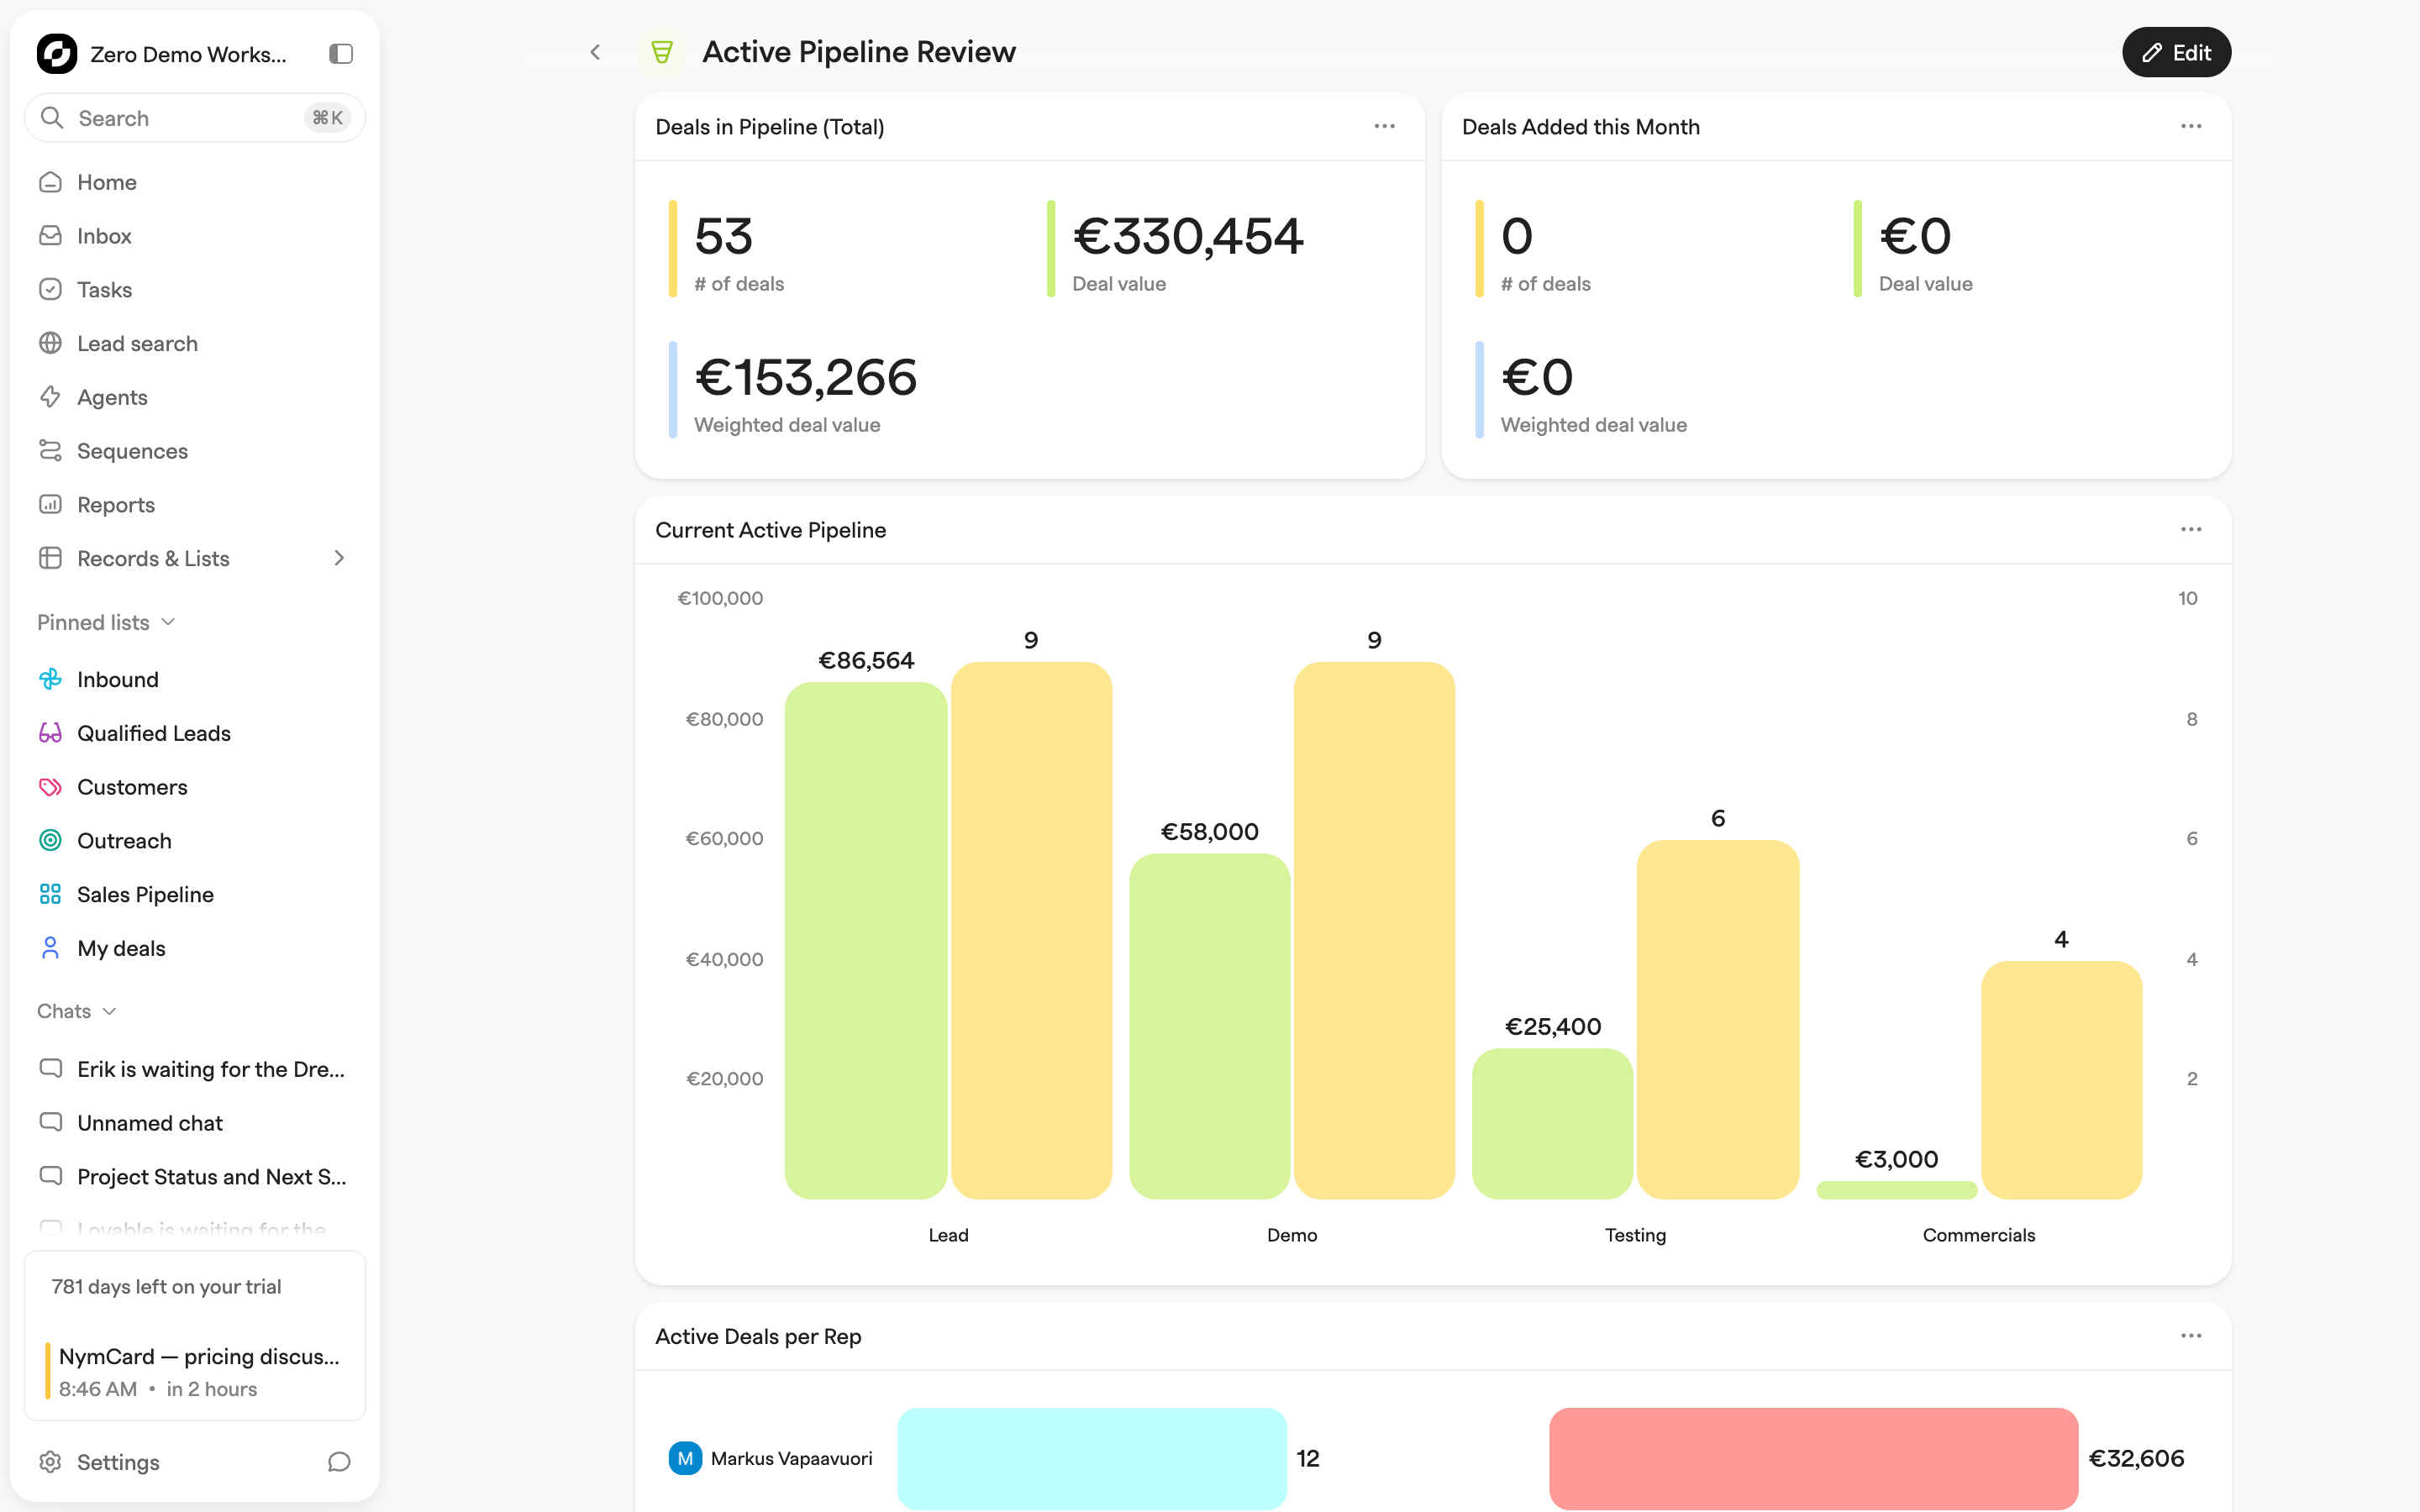
A dashboard is a grid of blocks. **Edit** enters edit mode, and the **Add** menu appends a **Chart**, a **Text** block written in place, or a full-width **Heading**. Hovering an empty grid cell inserts one exactly where you point.
In edit mode, drag blocks to reorder and their edges to resize, switch the grid between **8 columns** and **12 columns** (charts rescale with it), and name the dashboard and pick its icon and color from the toolbar.
Nothing is saved until you click **Save** — **Cancel** throws the session away. Removed blocks wait in a restore tray at the bottom until then, and editing supports undo and redo, so experimenting is cheap.
Each chart's **⋯** menu holds **Edit chart**, **Clone chart** and **Remove chart**.
## Chart types
Five types, switchable at the top of the chart settings:
| Type | Use for |
| -------------------- | ------------------------------------------------------- |
| Bar chart | Values over a category or time axis, optionally stacked |
| Horizontal bar chart | Rankings and top-N breakdowns |
| Line chart | Trends over time |
| KPIs | Single numbers, no dimensions |
| Pie chart | Share of a whole across one dimension |
## Configuring a chart
Selecting a chart in edit mode opens the **Chart settings** sidebar.
### Record Type
What the chart queries:
* **Deals**, **Companies**, **Contacts**, **Pipeline stages**
* **Activities** — Company activities, Contact activities, Custom activities, Emails, Email threads, Tasks, Meetings, and LinkedIn (messages, message threads, connections)
* **Product analytics** — Analytics events, Analytics sessions, Issues
* **Stripe** — Invoices and Subscriptions (requires a connected Stripe integration)
* **Other** — Files
* **Deal history** — a time-series snapshot of your pipeline over time, always charted over its date axis
Switching record type resets filters, metrics and dimensions to that type's defaults, but keeps the chart's size on the grid.
### Filters
The same filter bar as list views, custom properties and dynamic values (the current user, for instance) included, with the full set of operators per field type.
### Date range
Appears once the chart has a date dimension. Fixed dates, or a relative preset: Last 30/60/90 days, This week, Last week, This month, Last month, This quarter, Last quarter, This year, This year until today, Last year, Lifetime. Relative presets re-resolve on every load, so the chart never goes stale.
### Metrics
What the chart plots. Record counts, plus any numeric field — custom properties of type number, integer, percentage or currency included — aggregated as **Sum**, **Average**, **Min** or **Max**. Each metric has its own color, drags into order, and (everywhere except KPIs and pie charts) has a **Show KPI** toggle that puts its total above the chart.
### Dimensions
How values are grouped — not applicable to KPIs. One dimension for the main axis, optionally a second to split each bar or line into series. By field type:
* **Date fields** bucket by **Date**, **Week**, **Weekday**, **Month**, **Quarter**, or **Year**.
* **Stage, select, and boolean fields** let you choose which options are visible and set a color per option.
* **Numeric fields** can be bucketed into custom value ranges.
* Some record types have a required dimension — Deal history is always charted over its date axis, shown with a lock icon.
### Order by and Limit
Bar and horizontal bar charts sort by any metric in either direction and cap the number of bars. Horizontal bars can roll everything past the cap into an **Other** bar.
### Advanced
Bar, horizontal bar and line charts add display settings: **Show differences** (**Compare to** the first or previous value, **Show as** a ratio, delta or absolute number), **Show cumulative values**, **Show value in bar**, **Show goal line**, **Highlight weekends**, **Use same scale for all metrics**, **Fit scale to data**, and label toggles.
## Chart templates
**Templates** at the top of the chart settings starts you from a working configuration instead of a blank one. They are grouped by use case — **Weekly Pipeline Review**, **Customer Segmentation**, **Conversion Insights** — and filtered by record type. Selecting one previews it live; **Apply** keeps it, **Cancel** puts your configuration back. See [Reporting Examples](/features/reports/reporting-examples.md) for how the most useful ones are built.
Charts also name themselves as you configure them. Type your own name and that stops — the name is yours from then on.
## Viewing charts
Outside edit mode a dashboard is read-only, but not static. Every chart with a date dimension has its own date-range control in its header, and clicking any bar, point or slice expands the chart fullscreen with a **Drilldown values** table of the records behind it.
## Reports via API and MCP
Dashboards and reports are ordinary API models: `dashboards`, `reports` and `dashboardFolders` are readable and writable through the [REST API](/developers/api.md).
Over [MCP](/developers/mcp.md) and in chat, assistants use `find_dashboards`, `add_dashboard`, `edit_dashboard`, `find_reports`, `add_report`, `edit_report` — and `read_report`, which returns a report's computed data rather than its definition.
---
# Agent Instructions
This documentation is published with GitBook. GitBook is the documentation platform designed so that both humans and AI agents can read, navigate, and reason over technical content effectively. Learn more at gitbook.com.
## Querying This Documentation
If you need additional information that is not directly available in this page, you can query the documentation dynamically by asking a question.
Perform an HTTP GET request on the current page URL with the `ask` query parameter, and the optional `goal` query parameter:
```
GET https://docs.zero.inc/features/reports.md?ask=&goal=
```
`ask` is the immediate question: it should be specific, self-contained, and written in natural language.
`goal` is optional and describes the broader end goal you are ultimately trying to accomplish on behalf of the user. GitBook uses it to tailor the answer towards what is most useful for that goal.
The response will contain a direct answer to the question and relevant excerpts and sources from the documentation.
Use this mechanism when the answer is not explicitly present in the current page, you need clarification or additional context, or you want to retrieve related documentation sections.