> For the complete documentation index, see [llms.txt](https://docs.zero.inc/llms.txt). Markdown versions of documentation pages are available by appending `.md` to page URLs; this page is available as [Markdown](https://docs.zero.inc/features/reports/reporting-examples.md).
# Reporting Examples
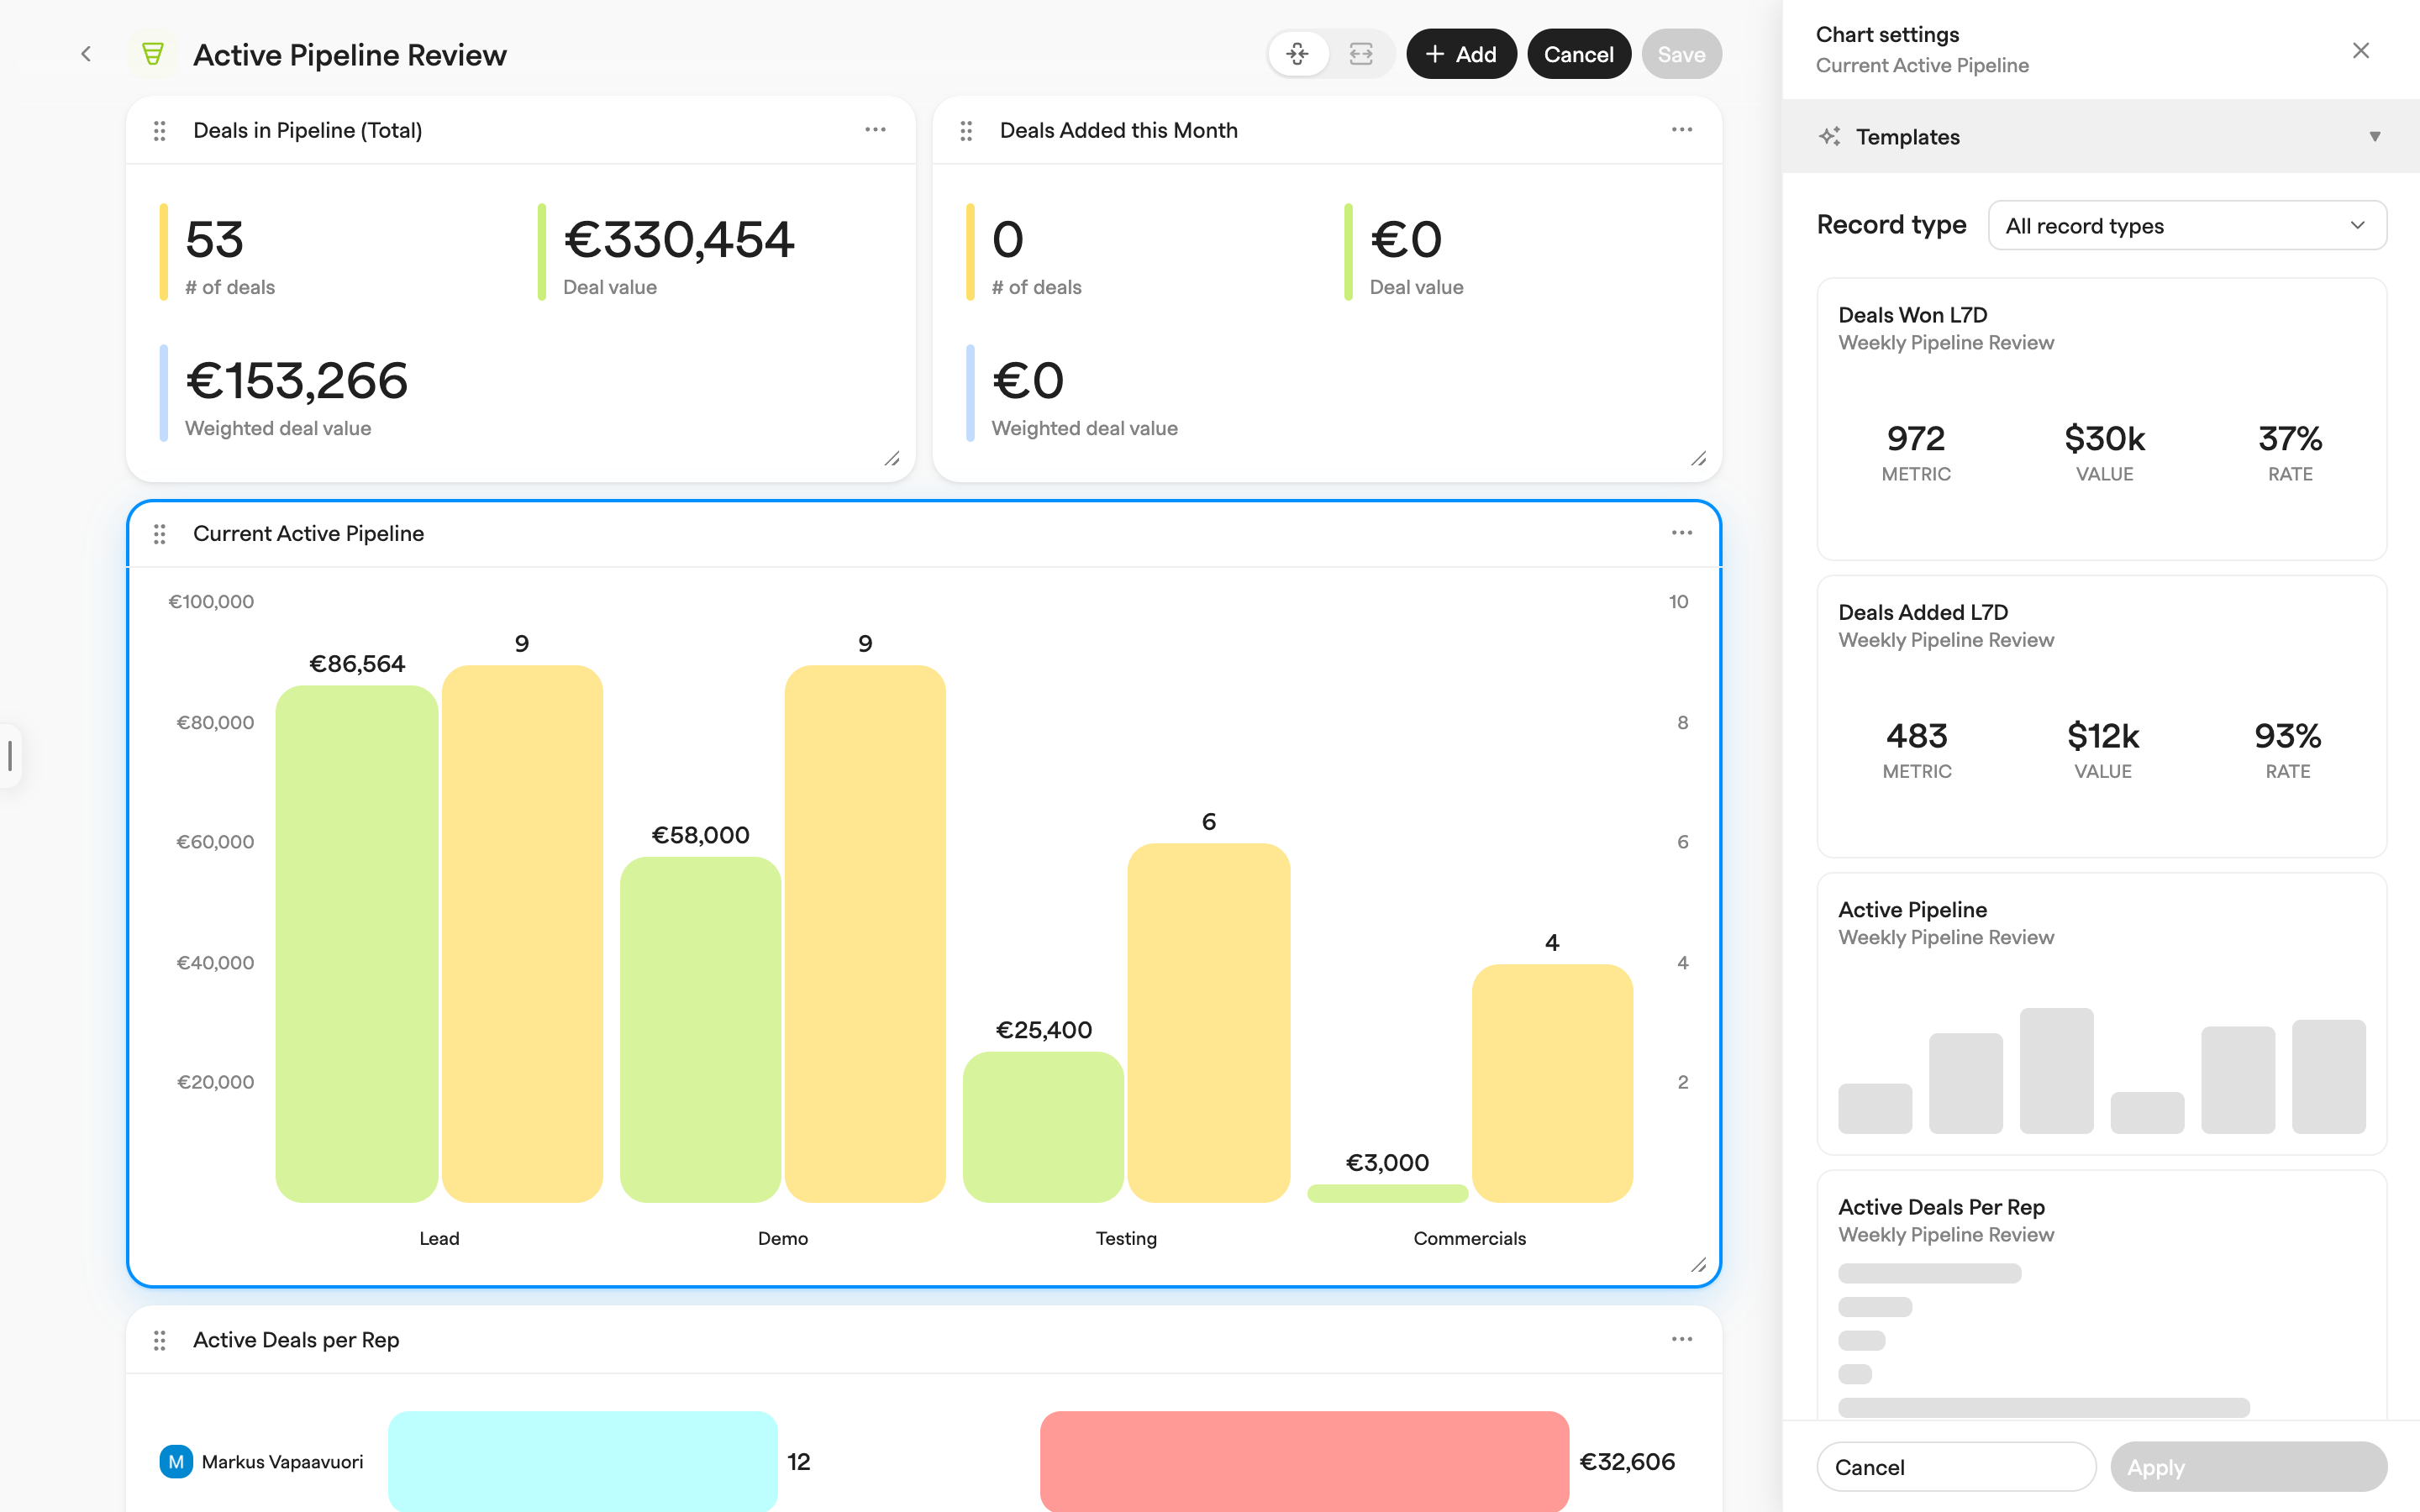
Charts are easier to copy than to design. Each example below is a real chart with the exact settings to enter: open a dashboard, click **Edit**, then a chart (or **Add > Chart**) to open its **Chart settings**. Every name here — record types, metrics, dimensions, operators — is the label you will see in the sidebar.
## Start from a template
Quicker still: in **Chart settings** click **Templates**, narrow by **Record type** if you like, and click a card. The chart previews it live; **Apply** keeps it, **Cancel** restores what you had. Applying a template never changes the chart's size on the grid.
Templates come from three built-in collections:
* **Weekly Pipeline Review** — won/added deal KPIs, active pipeline by stage, deals per rep, top 10 open opportunities, deals won by week, sales forecast, meetings booked, active email threads.
* **Customer Segmentation** — accounts by owner, region, industry, and employee-count buckets, scoped to companies with won deals.
* **Conversion Insights** — conversion rates per stage, won/lost ratio, average time in stage, cumulative time to close.
Once applied, a template is an ordinary chart. The examples below take the most useful ones apart, so you can build or adapt them yourself.
## Active pipeline by stage
How much open pipeline sits in each stage right now.
* **Chart type**: Bar chart
* **Record Type**: Deals
* **Metrics**: `# of deals` and `Deal value` (**Sum**)
* **Dimensions**: `Stage → Type`, with only the **Lead** and **In progress** options visible (use the settings icon on the dimension row to choose visible options), or `Stage` for one bar per pipeline stage
* **Filters**: `Stage → Type` **Not in** `Won`, `Lost`
Turn on the eye toggle (**Show KPI**) on each metric to show the headline totals above the bars.
## Deals won over time
Closed-won volume and value, bucketed by week.
* **Chart type**: Bar chart
* **Record Type**: Deals
* **Metrics**: `Deal value` (**Sum**) and `# of deals`
* **Dimensions**: `Close date`, bucketed by **Week** (a date dimension offers **Date**, **Week**, **Weekday**, **Month**, **Quarter**, and **Year** buckets)
* **Filters**: `Stage → Type` **Equals** `Won`
* **Date range**: Last 60 days
The **Date range** control appears as soon as the chart has a date or timestamp dimension, and offers relative presets (Last 30/60/90 days, This/Last week, This/Last month, This/Last quarter, This year, This year until today, Last year, Lifetime) as well as fixed dates. Relative presets re-resolve every time the chart loads, so the chart stays current.
## KPI tiles: deals won in the last 7 days
A row of headline numbers with no chart body.
* **Chart type**: KPIs
* **Record Type**: Deals
* **Metrics**: `# of deals`, `Deal value` (**Sum**), `Weighted deal value` (**Sum**)
* **Filters**: `Stage → Type` **Equals** `Won`; `Close date` **On or after** a relative value of 7 days ago
KPI charts have no Dimensions section — each metric renders as one tile. `Weighted deal value` is deal value multiplied by the deal's confidence percentage.
## Sales forecast for this quarter
Expected revenue by close month, weighted by confidence.
* **Chart type**: Bar chart
* **Record Type**: Deals
* **Metrics**: `# of deals` and `Weighted deal value` (**Sum**)
* **Dimensions**: `Close date`, bucketed by **Month**
* **Filters**: `Stage → Type` **Not in** `Won`, `Lost`
* **Date range**: This quarter
For a running total instead of per-month bars, open **Advanced** and enable **Show cumulative values**.
## Top 10 open opportunities
The biggest open deals, one bar each.
* **Chart type**: Horizontal bar chart
* **Record Type**: Deals
* **Metrics**: `Deal value` (**Sum**)
* **Dimensions**: `Name`
* **Filters**: `Stage → Type` **In** `Lead`, `In progress`; `Deal value` **>** `0`
* **Order by**: `Deal value`, descending
* **Limit**: 10
**Order by** and **Limit** are available on bar and horizontal bar charts. On horizontal bars, rows beyond the limit are grouped into an "Other" bar by default — disable **Group extra bars into "Other"** under **Advanced** to drop them instead.
## Active deals per rep
Workload and pipeline ownership across the team.
* **Chart type**: Horizontal bar chart
* **Record Type**: Deals
* **Metrics**: `# of deals` and `Deal value` (**Sum**)
* **Dimensions**: `Owners`
* **Filters**: `Stage → Type` **In** `Lead`, `In progress`
An `Owners` dimension produces one bar per user, plus an N/A bar for unowned deals. Use the settings icon on the dimension row to recolor individual users.
## Customer segmentation: accounts by industry
Where your closed-won business comes from.
* **Chart type**: Horizontal bar chart
* **Record Type**: Companies
* **Metrics**: `# of companies`
* **Dimensions**: `Industry` (or `Location → Country` for a regional split)
* **Filters**: `Deals → Stage → Type` **Equals** `Won`
* **Order by**: `# of companies`, descending
* **Limit**: 10
Filtering on `Deals → Stage → Type` scopes the chart to companies that have at least one won deal — i.e. actual customers.
## Companies by employee count (custom buckets)
Segment accounts into size bands.
* **Chart type**: Bar chart
* **Record Type**: Companies
* **Metrics**: `# of companies`
* **Dimensions**: `Employee amount`
A numeric dimension (number, currency, or percentage) shows a bucket editor button on its dimension row. Define your own boundaries there — for example `10, 50, 100, 500, 1000, 5000` — to get bars for <10, 10–50, 50–100, and so on. Any numeric custom property works the same way.
## Funnel: conversion rate per stage
How many deals ever reached each stage, and what share survives each transition.
* **Chart type**: Bar chart
* **Record Type**: Pipeline stages
* **Metrics**: `# of deals in this stage (lifetime)`
* **Dimensions**: the stage itself — one bar per stage, in pipeline order
* **Filters**: `Pipeline` — if the workspace has more than one pipeline, adding a stage dimension seeds this filter automatically (scoped to the first pipeline); change it to the pipeline you want
* **Advanced**: enable **Show differences** and set **Compare to** `Previous` — each bar then shows the share of deals retained from the previous stage. **Show as** switches the label between ratio (`120%`), delta (`+20%`), and absolute (`+5`) formats.
The Pipeline stages record type also offers `# of deals currently in this stage`, `# of deals previously in this stage`, `Average time in stage (lifetime)`, and `Average time in previous stages`. Swap the metric to `Average time in stage (lifetime)` for a stage-velocity chart, and add **Show cumulative values** to see total time to close build up across stages.
## Pipeline value over time (Deal history)
Most record types report on the current state of your data. **Deal history** is a time-series snapshot of your deals, so it can answer "what did the pipeline look like in March?".
* **Chart type**: Bar chart or Line chart
* **Record Type**: Deal history
* **Metrics**: `Deal value` (**Sum**)
* **Dimensions**: `Date` — mandatory for this record type (it is locked as the first dimension and cannot be removed); bucket it by **Week** or **Month**
* **Dimensions** (optional second): `Stage`, to stack each bar by pipeline stage
* **Filters**: `Stage → Type` **Not in** `Won`, `Lost` to chart only open pipeline
* **Date range**: defaults to Lifetime; narrow it to the window you care about
## Activity volume
The same pattern works for activity record types. From the Weekly Pipeline Review template:
* **Meetings booked** — Record Type **Meetings**, metric `# of calendar events`, dimension `Start time` bucketed by **Week**, date range Last 60 days.
* **Active email threads** — Record Type **Contact activities**, metric `# of contact activities`, dimension `Time` bucketed by **Week**, filter `Type` **In** `Email`, date range Last 60 days.
Other countable record types include Emails, Email threads, Tasks, Custom activities, Files, and — under LinkedIn — LinkedIn messages, message threads, and connections.
## Beyond the CRM
* **Stripe** (record types **Invoices** and **Subscriptions**): metrics such as `Total amount`, `Total MRR`, `Total ARR`, and `Subscription quantity`. These record types are disabled until a Stripe account is connected to the workspace.
* **Product analytics** (record types **Analytics events**, **Analytics sessions**, **Issues**): metrics such as `# of unique domains`, `# of pageviews`, `Session duration`, `Average response time`, and `Average resolution time`.
* **Custom properties**: every numeric custom property (number, integer, percentage, currency) on a record type is automatically available as a metric with **Sum**, **Average**, **Min**, and **Max** ops, and most property types are available as dimensions and filters.
---
# Agent Instructions
This documentation is published with GitBook. GitBook is the documentation platform designed so that both humans and AI agents can read, navigate, and reason over technical content effectively. Learn more at gitbook.com.
## Querying This Documentation
If you need additional information that is not directly available in this page, you can query the documentation dynamically by asking a question.
Perform an HTTP GET request on the current page URL with the `ask` query parameter, and the optional `goal` query parameter:
```
GET https://docs.zero.inc/features/reports/reporting-examples.md?ask=&goal=
```
`ask` is the immediate question: it should be specific, self-contained, and written in natural language.
`goal` is optional and describes the broader end goal you are ultimately trying to accomplish on behalf of the user. GitBook uses it to tailor the answer towards what is most useful for that goal.
The response will contain a direct answer to the question and relevant excerpts and sources from the documentation.
Use this mechanism when the answer is not explicitly present in the current page, you need clarification or additional context, or you want to retrieve related documentation sections.